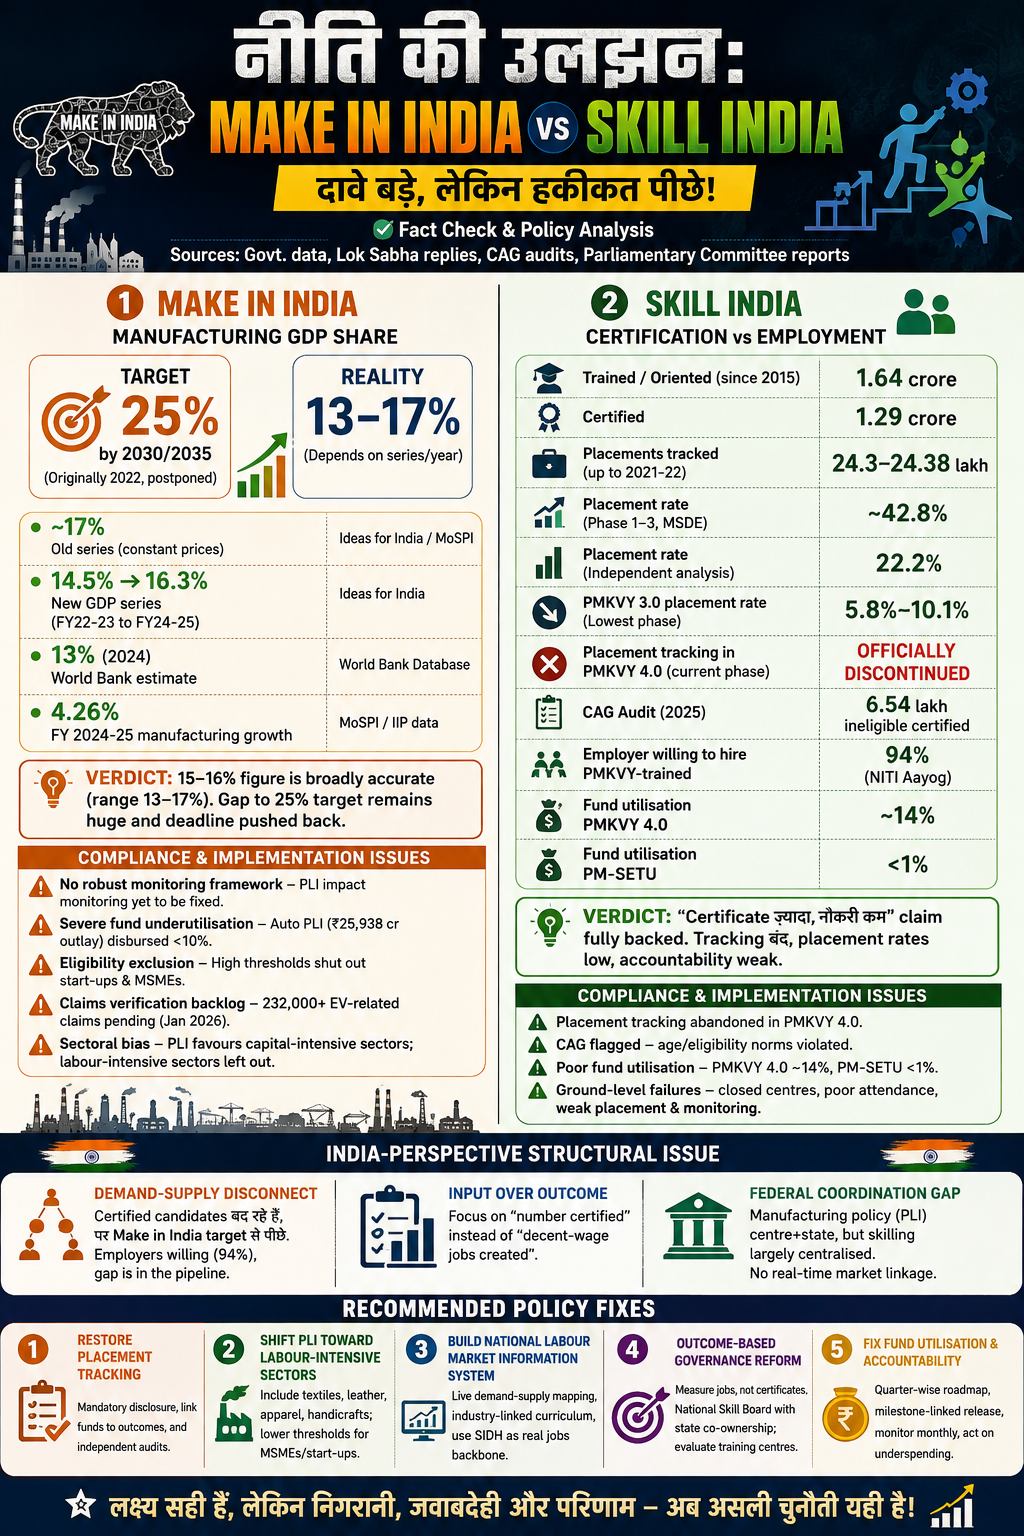
नीति की उलझन: Make in India vs Skill India — Fact Check & Policy Analysis

नीति की उलझन: Make in India vs Skill India — Fact Check & Policy Analysis
Compiled from government data, Parliamentary Standing Committee reports, CAG audits, and Lok Sabha replies.
1. Make in India — Manufacturing GDP Share
Claim in circulation: 25% target vs 15–16% reality
Verified data:
| Metric | Value | Source |
|---|---|---|
| Current manufacturing share of GDP (old series, constant prices) | ~17% | Ideas for India / MoSPI |
| New GDP series share (rising trend) | 14.5% (FY22-23) → 16.3% (FY24-25) | Ideas for India |
| World Bank estimate | 13% (2024) | World Bank Database |
| Original target | 25% by 2022, pushed to 2030/2035 | DPIIT / Make in India |
| FY 2024-25 manufacturing growth | 4.26% | MoSPI / IIP data |
Verdict: The 15–16% figure in the image is broadly accurate depending on which GDP series/year is used (range is roughly 13–17%). The gap to the 25% target remains substantial and the deadline has already been pushed back once (2022 → 2030/2035).
2. Skill India — Certification vs Employment
Claim in circulation: 40 crore skilled target, but certificates ≠ jobs
Verified data (PMKVY, 2015–present):
| Metric | Value | Source |
|---|---|---|
| Candidates trained/oriented since 2015 | 1.64 crore | Lok Sabha reply, MSDE |
| Candidates certified | 1.29 crore | MSDE |
| Placements officially tracked (up to 2021-22) | 24.3–24.38 lakh | MSDE / Lok Sabha |
| Placement rate (Phase 1–3 combined, MSDE figure) | ~42.8% | MSDE |
| Placement rate (independent Business Standard analysis, March 2023) | 22.2% | Business Standard |
| PMKVY 3.0 placement rate (lowest phase) | 5.8%–10.1% | IndiaSpend / Business Standard |
| Placement tracking under PMKVY 4.0 (current phase) | Officially discontinued | MSDE admission to Lok Sabha, Aug 2025 |
| CAG audit finding (2025) | 6.54 lakh certified candidates across 705 job roles did not meet minimum entry-age norms | CAG |
| Employer willingness to hire more PMKVY-trained candidates | 94% (NITI Aayog survey) | NITI Aayog |
| PMKVY 4.0 fund utilisation | ~14% of allocation spent | Parliamentary Standing Committee |
| PM-SETU fund utilisation | <1% | Parliamentary Standing Committee |
Verdict: The "certificate ज़्यादा, नौकरी कम" claim is directly supported by government's own admission — placement tracking itself has been discontinued in the current phase, and even historical placement rates ranged widely from ~6% to ~43% depending on how they're measured.
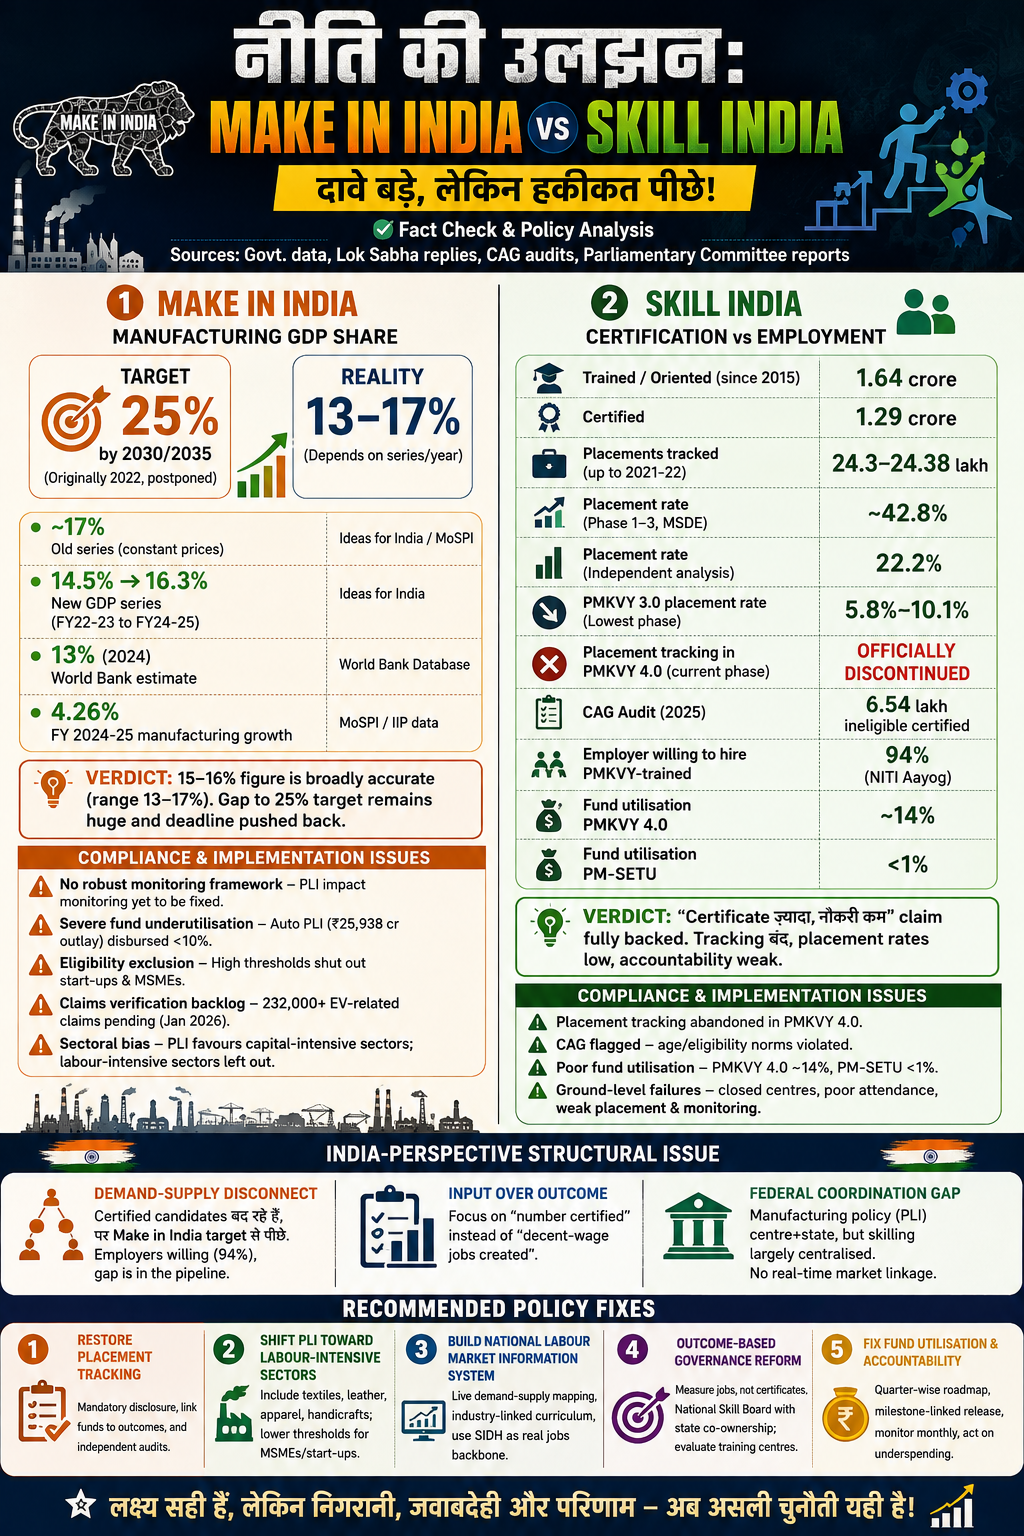
3. Compliance & Implementation Issues (Per Scheme)
Make in India / PLI Scheme
- No robust monitoring framework — flagged explicitly by the Parliamentary Standing Committee on Commerce, which called for a framework to monitor and report scheme impact.
- Severe fund underutilisation — Auto PLI (₹25,938 crore outlay) has disbursed less than 10% of its budget.
- Eligibility exclusion — thresholds shut out domestic start-ups and MSMEs in sectors like automobiles.
- Claims-verification backlog — 232,000+ EV-related claims pending as of Jan 2026 due to VAHAN database integration issues.
- Sectoral bias — PLI favours capital-intensive sectors (mobiles, autos, pharma); labour-intensive sectors (textiles, leather, apparel, handicrafts) — which actually employ mass low-skill labour — were left out until committee recommendations pushed for expansion.
Skill India / PMKVY
- Placement tracking abandoned in PMKVY 4.0 — flagged by Parliamentary panel as removing the "real barometer for measuring the success of the scheme."
- CAG-flagged certification fraud/eligibility gaps — candidates certified despite not meeting age or educational eligibility norms.
- Poor fund utilisation — PMKVY 4.0 spent ~14%, PM-SETU under 1% of allocation.
- Ground-level failures — closed training centres, weak attendance compliance, gaps in placement strategy and monitoring found during field inspections.
4. India-Perspective Structural Issue
Both schemes reflect a deeper governance mismatch:
- Demand-supply disconnect — Skill India keeps producing certified candidates while Make in India (the sector meant to absorb them) is ~9 percentage points behind its own target. Employers report high willingness to hire (94%, NITI Aayog) — the gap is in the placement pipeline, not employer demand.
- Input metrics over outcome metrics — governance measures "number trained/certified" rather than "number employed at decent wages." The Standing Committee has explicitly recommended this shift.
- Federal coordination gap — manufacturing policy (PLI) is centre-plus-state industrial policy, while skilling is a largely centralised scheme; there is no real-time National Labour Market Information System linking the two.
5. Recommended Policy Fixes
| # | Fix | Core Action |
|---|---|---|
| 1 | Restore & mandate placement tracking | Make placement data disclosure mandatory in Parliament; link fund disbursal to verified outcomes, not enrollment; fixed-cycle independent (CAG-style) audits |
| 2 | Shift PLI toward labour-intensive sectors | Extend PLI to textiles, leather, apparel, handicrafts; tiered investment thresholds for MSME/start-up inclusion; fix claims-verification bottlenecks |
| 3 | Build a National Labour Market Information System | Live demand-supply skill mapping by sector/district; curriculum revision tied to industry hiring data; use Skill India Digital Hub (SIDH) as a real jobs backbone, not just a certificate portal |
| 4 | Outcome-based governance reform | Redefine KPIs as "decent-wage jobs created" not "candidates certified"; set up a National-Level Skill Board with state co-ownership; independent evaluation of training-centre efficacy before empanelment renewal |
| 5 | Fix fund utilisation & accountability | Quarter-wise expenditure roadmaps tied to verified milestones (not lump-sum BE-RE budgeting); monthly monitoring of capacity commissioning; flag/penalize chronically underspending centres |
Sources
- Ideas for India — Net assessment of India's manufacturing sector
- IBEF — Manufacturing Industries in India & its Growth
- India Briefing — India Manufacturing Tracker 2024-25
- IndiaSpend — Govt's Skill Development Scheme Placed Only 18% Candidates
- Business Standard — Only 22% of candidates trained under PMKVY found a job
- Daily Pioneer — Skill India at 11: Bridging India's Skills Gap
- Careers360 — Govt trained 1.64 crore under PMKVY since 2015; but stopped tracking placements
- KNN India / Business Standard / Vision IAS / EVreporter — Parliamentary Standing Committee reports on PLI scheme (Commerce, Industry, Heavy Industries)
- India Tech Desk — Auto PLI Scheme Reckoning: EV Startups Fight Back
- Legacy IAS — Skill India Mission & PMKVY 4.0
Note: Figures are drawn from publicly available government replies (Lok Sabha), CAG audit reports, Parliamentary Standing Committee reports, and reputable secondary analyses. Where official data conflicts (e.g., MSDE-reported vs independently analysed placement rates), both figures are presented for transparency.